clisops regridding functionalities - powered by xesmf
The regridding functionalities of clisops consist of the regridding operator/function regrid in clisops.ops, allowing one-line remapping of xarray.Datasets or xarray.DataArrays, while orchestrating the use of classes and functions in clisops.core:
the
GridandWeightsclasses, to check and pre-process input as well as output grids and to generate the remapping weightsa
regridfunction, performing the remapping by applying the generated weights on the input data
For the weight generation and the regridding, the xESMF Regridder class is used, which itself allows an easy application of many of the remapping functionalities of ESMF/ESMPy.
[1]:
# Imports

%matplotlib inline
# Set required environment variable for ESMPy
import os
from pathlib import Path

import cartopy.crs as ccrs
import cf_xarray as cfxr
import matplotlib.pyplot as plt
import numpy as np
import xarray as xr
from matplotlib.collections import PolyCollection

os.environ["ESMFMKFILE"] = str(Path(os.__file__).parent.parent / "esmf.mk")
import xesmf as xe
from roocs_grids import grid_annotations

import clisops as cl  # atm. the regrid-main-martin branch of clisops
import clisops.core as clore
import clisops.ops as clops

print(f"Using xarray in version {xr.__version__}")
print(f"Using cf_xarray in version {cfxr.__version__}")
print(f"Using xESMF in version {xe.__version__}")
print(f"Using clisops in version {cl.__version__}")

xr.set_options(display_style="html")
Matplotlib is building the font cache; this may take a moment.
Using xarray in version 2025.10.1
Using cf_xarray in version 0.11.3
Using xESMF in version 0.9.2
Using clisops in version 0.18.1
[1]:
<xarray.core.options.set_options at 0x7a02c5d355e0>
[2]:
# Initialize the testing data
import clisops.utils.testing as clite

Stratus = clite.stratus(
    repo=clite.ESGF_TEST_DATA_REPO_URL, branch=clite.ESGF_TEST_DATA_VERSION, cache_dir=clite.ESGF_TEST_DATA_CACHE_DIR
)

mini_esgf_data = (
    clite.get_esgf_file_paths(Stratus.path) or clite.get_esgf_glob_paths(Stratus.path) or clite.get_kerchunk_datasets()
)
clisops.ops.regrid
One-line remapping with clisops.ops.regrid:
def regrid(
    ds: Union[xr.Dataset, str, Path],
    *,
    method: Optional[str] = "nearest_s2d",
    adaptive_masking_threshold: Optional[Union[int, float]] = 0.5,
    grid: Optional[Union[xr.Dataset, xr.DataArray, int, float, tuple, str]] = "adaptive",
    output_dir: Optional[Union[str, Path]] = None,
    output_type: Optional[str] = "netcdf",
    split_method: Optional[str] = "time:auto",
    file_namer: Optional[str] = "standard",
    keep_attrs: Optional[Union[bool, str]] = True,
) -> List[Union[xr.Dataset, str]]:
    pass
The different options for the method, grid and adaptive_masking_threshold parameters are described in below sections:
Remap a global xarray.Dataset to a global 2.5 degree grid using the bilinear method
Load the dataset
[3]:
ds_vert = xr.open_dataset(mini_esgf_data["CMIP6_ATM_VERT_ONE_TIMESTEP"])
ds_vert
---------------------------------------------------------------------------
KeyError                                  Traceback (most recent call last)
File ~/checkouts/readthedocs.org/user_builds/clisops/conda/latest/lib/python3.12/site-packages/xarray/backends/file_manager.py:219, in CachingFileManager._acquire_with_cache_info(self, needs_lock)
    218 try:
--> 219     file = self._cache[self._key]
    220 except KeyError:

File ~/checkouts/readthedocs.org/user_builds/clisops/conda/latest/lib/python3.12/site-packages/xarray/backends/lru_cache.py:56, in LRUCache.__getitem__(self, key)
     55 with self._lock:
---> 56     value = self._cache[key]
     57     self._cache.move_to_end(key)

KeyError: [<class 'h5netcdf.core.File'>, ('/home/docs/.cache/mini-esgf-data/v1/badc/cmip6/data/CMIP6/CMIP/MPI-M/MPI-ESM1-2-LR/historical/r1i1p1f1/AERmon/o3/gn/v20190710/o3_AERmon_MPI-ESM1-2-LR_historical_r1i1p1f1_gn_185001.nc',), 'r', (('decode_vlen_strings', True), ('driver', None), ('invalid_netcdf', None), ('phony_dims', 'access')), '37684298-d9ae-40eb-bb6c-9e64eff728ea']

During handling of the above exception, another exception occurred:

FileNotFoundError                         Traceback (most recent call last)
Cell In[3], line 1
----> 1 ds_vert = xr.open_dataset(mini_esgf_data["CMIP6_ATM_VERT_ONE_TIMESTEP"])
      2 ds_vert

File ~/checkouts/readthedocs.org/user_builds/clisops/conda/latest/lib/python3.12/site-packages/xarray/backends/api.py:596, in open_dataset(filename_or_obj, engine, chunks, cache, decode_cf, mask_and_scale, decode_times, decode_timedelta, use_cftime, concat_characters, decode_coords, drop_variables, create_default_indexes, inline_array, chunked_array_type, from_array_kwargs, backend_kwargs, **kwargs)
    584 decoders = _resolve_decoders_kwargs(
    585     decode_cf,
    586     open_backend_dataset_parameters=backend.open_dataset_parameters,
   (...)    592     decode_coords=decode_coords,
    593 )
    595 overwrite_encoded_chunks = kwargs.pop("overwrite_encoded_chunks", None)
--> 596 backend_ds = backend.open_dataset(
    597     filename_or_obj,
    598     drop_variables=drop_variables,
    599     **decoders,
    600     **kwargs,
    601 )
    602 ds = _dataset_from_backend_dataset(
    603     backend_ds,
    604     filename_or_obj,
   (...)    615     **kwargs,
    616 )
    617 return ds

File ~/checkouts/readthedocs.org/user_builds/clisops/conda/latest/lib/python3.12/site-packages/xarray/backends/h5netcdf_.py:502, in H5netcdfBackendEntrypoint.open_dataset(self, filename_or_obj, mask_and_scale, decode_times, concat_characters, decode_coords, drop_variables, use_cftime, decode_timedelta, format, group, lock, invalid_netcdf, phony_dims, decode_vlen_strings, driver, driver_kwds, storage_options)
    499 emit_phony_dims_warning, phony_dims = _check_phony_dims(phony_dims)
    501 filename_or_obj = _normalize_filename_or_obj(filename_or_obj)
--> 502 store = H5NetCDFStore.open(
    503     filename_or_obj,
    504     format=format,
    505     group=group,
    506     lock=lock,
    507     invalid_netcdf=invalid_netcdf,
    508     phony_dims=phony_dims,
    509     decode_vlen_strings=decode_vlen_strings,
    510     driver=driver,
    511     driver_kwds=driver_kwds,
    512     storage_options=storage_options,
    513 )
    515 store_entrypoint = StoreBackendEntrypoint()
    517 ds = store_entrypoint.open_dataset(
    518     store,
    519     mask_and_scale=mask_and_scale,
   (...)    525     decode_timedelta=decode_timedelta,
    526 )

File ~/checkouts/readthedocs.org/user_builds/clisops/conda/latest/lib/python3.12/site-packages/xarray/backends/h5netcdf_.py:226, in H5NetCDFStore.open(cls, filename, mode, format, group, lock, autoclose, invalid_netcdf, phony_dims, decode_vlen_strings, driver, driver_kwds, storage_options)
    220 manager_cls = (
    221     CachingFileManager
    222     if isinstance(filename, str) and not is_remote_uri(filename)
    223     else PickleableFileManager
    224 )
    225 manager = manager_cls(h5netcdf.File, filename, mode=mode, kwargs=kwargs)
--> 226 return cls(manager, group=group, mode=mode, lock=lock, autoclose=autoclose)

File ~/checkouts/readthedocs.org/user_builds/clisops/conda/latest/lib/python3.12/site-packages/xarray/backends/h5netcdf_.py:149, in H5NetCDFStore.__init__(self, manager, group, mode, lock, autoclose)
    146 self.format = None
    147 # todo: utilizing find_root_and_group seems a bit clunky
    148 #  making filename available on h5netcdf.Group seems better
--> 149 self._filename = find_root_and_group(self.ds)[0].filename
    150 self.is_remote = is_remote_uri(self._filename)
    151 self.lock = ensure_lock(lock)

File ~/checkouts/readthedocs.org/user_builds/clisops/conda/latest/lib/python3.12/site-packages/xarray/backends/h5netcdf_.py:237, in H5NetCDFStore.ds(self)
    235 @property
    236 def ds(self):
--> 237     return self._acquire()

File ~/checkouts/readthedocs.org/user_builds/clisops/conda/latest/lib/python3.12/site-packages/xarray/backends/h5netcdf_.py:229, in H5NetCDFStore._acquire(self, needs_lock)
    228 def _acquire(self, needs_lock=True):
--> 229     with self._manager.acquire_context(needs_lock) as root:
    230         ds = _nc4_require_group(
    231             root, self._group, self._mode, create_group=_h5netcdf_create_group
    232         )
    233     return ds

File ~/checkouts/readthedocs.org/user_builds/clisops/conda/latest/lib/python3.12/contextlib.py:137, in _GeneratorContextManager.__enter__(self)
    135 del self.args, self.kwds, self.func
    136 try:
--> 137     return next(self.gen)
    138 except StopIteration:
    139     raise RuntimeError("generator didn't yield") from None

File ~/checkouts/readthedocs.org/user_builds/clisops/conda/latest/lib/python3.12/site-packages/xarray/backends/file_manager.py:207, in CachingFileManager.acquire_context(self, needs_lock)
    204 @contextmanager
    205 def acquire_context(self, needs_lock: bool = True) -> Iterator[T_File]:
    206     """Context manager for acquiring a file."""
--> 207     file, cached = self._acquire_with_cache_info(needs_lock)
    208     try:
    209         yield file

File ~/checkouts/readthedocs.org/user_builds/clisops/conda/latest/lib/python3.12/site-packages/xarray/backends/file_manager.py:225, in CachingFileManager._acquire_with_cache_info(self, needs_lock)
    223     kwargs = kwargs.copy()
    224     kwargs["mode"] = self._mode
--> 225 file = self._opener(*self._args, **kwargs)
    226 if self._mode == "w":
    227     # ensure file doesn't get overridden when opened again
    228     self._mode = "a"

File ~/checkouts/readthedocs.org/user_builds/clisops/conda/latest/lib/python3.12/site-packages/h5netcdf/core.py:1907, in File.__init__(self, path, mode, format, invalid_netcdf, phony_dims, backend, **kwargs)
   1905     else:  # default h5py
   1906         self._h5py = h5py
-> 1907         self.__h5file, self._preexisting_file, self._close_h5file = _open_h5py(
   1908             path, mode, **kwargs
   1909         )
   1911 except Exception:
   1912     self._closed = True

File ~/checkouts/readthedocs.org/user_builds/clisops/conda/latest/lib/python3.12/site-packages/h5netcdf/core.py:1800, in _open_h5py(path, mode, **kwargs)
   1796 if isinstance(path, str):
   1797     exists = path.startswith(("http", "s3://")) or (
   1798         os.path.exists(path) and mode != "w"
   1799     )
-> 1800     h5file = h5py.File(path, mode, **kwargs)
   1801     return h5file, exists, True
   1802 elif isinstance(path, h5py.File):
   1803     # already-open file

File ~/checkouts/readthedocs.org/user_builds/clisops/conda/latest/lib/python3.12/site-packages/h5py/_hl/files.py:555, in File.__init__(self, name, mode, driver, libver, userblock_size, swmr, rdcc_nslots, rdcc_nbytes, rdcc_w0, track_order, fs_strategy, fs_persist, fs_threshold, fs_page_size, page_buf_size, min_meta_keep, min_raw_keep, locking, alignment_threshold, alignment_interval, meta_block_size, track_times, **kwds)
    546     fapl = make_fapl(driver, libver, rdcc_nslots, rdcc_nbytes, rdcc_w0,
    547                      locking, page_buf_size, min_meta_keep, min_raw_keep,
    548                      alignment_threshold=alignment_threshold,
    549                      alignment_interval=alignment_interval,
    550                      meta_block_size=meta_block_size,
    551                      **kwds)
    552     fcpl = make_fcpl(track_order=track_order, track_times=track_times,
    553                      fs_strategy=fs_strategy, fs_persist=fs_persist,
    554                      fs_threshold=fs_threshold, fs_page_size=fs_page_size)
--> 555     fid = make_fid(name, mode, userblock_size, fapl, fcpl, swmr=swmr)
    557 if isinstance(libver, tuple):
    558     self._libver = libver

File ~/checkouts/readthedocs.org/user_builds/clisops/conda/latest/lib/python3.12/site-packages/h5py/_hl/files.py:232, in make_fid(name, mode, userblock_size, fapl, fcpl, swmr)
    230     if swmr:
    231         flags |= h5f.ACC_SWMR_READ
--> 232     fid = h5f.open(name, flags, fapl=fapl)
    233 elif mode == 'r+':
    234     fid = h5f.open(name, h5f.ACC_RDWR, fapl=fapl)

File h5py/_objects.pyx:54, in h5py._objects.with_phil.wrapper()
---> 54 'Could not get source, probably due dynamically evaluated source code.'

File h5py/_objects.pyx:55, in h5py._objects.with_phil.wrapper()
---> 55 'Could not get source, probably due dynamically evaluated source code.'

File h5py/h5f.pyx:106, in h5py.h5f.open()
--> 106 'Could not get source, probably due dynamically evaluated source code.'

FileNotFoundError: [Errno 2] Unable to synchronously open file (unable to open file: name = '/home/docs/.cache/mini-esgf-data/v1/badc/cmip6/data/CMIP6/CMIP/MPI-M/MPI-ESM1-2-LR/historical/r1i1p1f1/AERmon/o3/gn/v20190710/o3_AERmon_MPI-ESM1-2-LR_historical_r1i1p1f1_gn_185001.nc', errno = 2, error message = 'No such file or directory', flags = 0, o_flags = 0)
Take a look at the grid
[4]:
# Create 2D coordinate variables
lon, lat = np.meshgrid(ds_vert["lon"].data, ds_vert["lat"].data)

# Plot
plt.figure(figsize=(8, 5))
plt.scatter(lon[::3, ::3], lat[::3, ::3], s=0.5)
plt.xlabel("lon")
plt.ylabel("lat")
---------------------------------------------------------------------------
NameError                                 Traceback (most recent call last)
Cell In[4], line 2
      1 # Create 2D coordinate variables
----> 2 lon, lat = np.meshgrid(ds_vert["lon"].data, ds_vert["lat"].data)
      3
      4 # Plot
      5 plt.figure(figsize=(8, 5))

NameError: name 'ds_vert' is not defined
Remap to global 2.5 degree grid with the bilinear method
[5]:
ds_remap = clops.regrid(ds_vert, method="bilinear", grid="2pt5deg", output_type="xarray")[0]
ds_remap
---------------------------------------------------------------------------
NameError                                 Traceback (most recent call last)
Cell In[5], line 1
----> 1 ds_remap = clops.regrid(ds_vert, method="bilinear", grid="2pt5deg", output_type="xarray")[0]
      2 ds_remap

NameError: name 'ds_vert' is not defined
Plot the remapped data next to the source data
[6]:
fig, axes = plt.subplots(ncols=2, figsize=(18, 4), subplot_kw={"projection": ccrs.PlateCarree()})
for ax in axes:
    ax.coastlines()

# Source data
ds_vert.o3.isel(time=0, lev=0).plot.pcolormesh(ax=axes[0], x="lon", y="lat", shading="auto")
axes[0].title.set_text("Source - MPI-ESM1-2-LR ECHAM6 (T63L47, ~1.9° resolution)")
# Remapped data
ds_remap.o3.isel(time=0, lev=0).plot.pcolormesh(ax=axes[1], x="lon", y="lat", shading="auto")
axes[1].title.set_text("Target - regular lat-lon (2.5° resolution)")
---------------------------------------------------------------------------
NameError                                 Traceback (most recent call last)
Cell In[6], line 6
      2 for ax in axes:
      3     ax.coastlines()
      4
      5 # Source data
----> 6 ds_vert.o3.isel(time=0, lev=0).plot.pcolormesh(ax=axes[0], x="lon", y="lat", shading="auto")
      7 axes[0].title.set_text("Source - MPI-ESM1-2-LR ECHAM6 (T63L47, ~1.9° resolution)")
      8 # Remapped data
      9 ds_remap.o3.isel(time=0, lev=0).plot.pcolormesh(ax=axes[1], x="lon", y="lat", shading="auto")

NameError: name 'ds_vert' is not defined
/home/docs/checkouts/readthedocs.org/user_builds/clisops/conda/latest/lib/python3.12/site-packages/cartopy/io/__init__.py:242: DownloadWarning: Downloading: https://naturalearth.s3.amazonaws.com/110m_physical/ne_110m_coastline.zip
  warnings.warn(f'Downloading: {url}', DownloadWarning)
Remap regional xarray.Dataset to a regional grid of adaptive resolution using the bilinear method
Adaptive resolution means, that the regular lat-lon target grid will have approximately the same resolution as the source grid.
Load the dataset
[7]:
ds_cordex = xr.open_dataset(mini_esgf_data["CORDEX_TAS_ONE_TIMESTEP"])
ds_cordex
---------------------------------------------------------------------------
KeyError                                  Traceback (most recent call last)
File ~/checkouts/readthedocs.org/user_builds/clisops/conda/latest/lib/python3.12/site-packages/xarray/backends/file_manager.py:219, in CachingFileManager._acquire_with_cache_info(self, needs_lock)
    218 try:
--> 219     file = self._cache[self._key]
    220 except KeyError:

File ~/checkouts/readthedocs.org/user_builds/clisops/conda/latest/lib/python3.12/site-packages/xarray/backends/lru_cache.py:56, in LRUCache.__getitem__(self, key)
     55 with self._lock:
---> 56     value = self._cache[key]
     57     self._cache.move_to_end(key)

KeyError: [<class 'h5netcdf.core.File'>, ('/home/docs/.cache/mini-esgf-data/v1/pool/data/CORDEX/data/cordex/output/EUR-22/GERICS/MPI-M-MPI-ESM-LR/rcp85/r1i1p1/GERICS-REMO2015/v1/mon/tas/v20191029/tas_EUR-22_MPI-M-MPI-ESM-LR_rcp85_r1i1p1_GERICS-REMO2015_v1_mon_202101.nc',), 'r', (('decode_vlen_strings', True), ('driver', None), ('invalid_netcdf', None), ('phony_dims', 'access')), '6a74e104-b44a-4a5f-bdc1-556020a9a75f']

During handling of the above exception, another exception occurred:

FileNotFoundError                         Traceback (most recent call last)
Cell In[7], line 1
----> 1 ds_cordex = xr.open_dataset(mini_esgf_data["CORDEX_TAS_ONE_TIMESTEP"])
      2 ds_cordex

File ~/checkouts/readthedocs.org/user_builds/clisops/conda/latest/lib/python3.12/site-packages/xarray/backends/api.py:596, in open_dataset(filename_or_obj, engine, chunks, cache, decode_cf, mask_and_scale, decode_times, decode_timedelta, use_cftime, concat_characters, decode_coords, drop_variables, create_default_indexes, inline_array, chunked_array_type, from_array_kwargs, backend_kwargs, **kwargs)
    584 decoders = _resolve_decoders_kwargs(
    585     decode_cf,
    586     open_backend_dataset_parameters=backend.open_dataset_parameters,
   (...)    592     decode_coords=decode_coords,
    593 )
    595 overwrite_encoded_chunks = kwargs.pop("overwrite_encoded_chunks", None)
--> 596 backend_ds = backend.open_dataset(
    597     filename_or_obj,
    598     drop_variables=drop_variables,
    599     **decoders,
    600     **kwargs,
    601 )
    602 ds = _dataset_from_backend_dataset(
    603     backend_ds,
    604     filename_or_obj,
   (...)    615     **kwargs,
    616 )
    617 return ds

File ~/checkouts/readthedocs.org/user_builds/clisops/conda/latest/lib/python3.12/site-packages/xarray/backends/h5netcdf_.py:502, in H5netcdfBackendEntrypoint.open_dataset(self, filename_or_obj, mask_and_scale, decode_times, concat_characters, decode_coords, drop_variables, use_cftime, decode_timedelta, format, group, lock, invalid_netcdf, phony_dims, decode_vlen_strings, driver, driver_kwds, storage_options)
    499 emit_phony_dims_warning, phony_dims = _check_phony_dims(phony_dims)
    501 filename_or_obj = _normalize_filename_or_obj(filename_or_obj)
--> 502 store = H5NetCDFStore.open(
    503     filename_or_obj,
    504     format=format,
    505     group=group,
    506     lock=lock,
    507     invalid_netcdf=invalid_netcdf,
    508     phony_dims=phony_dims,
    509     decode_vlen_strings=decode_vlen_strings,
    510     driver=driver,
    511     driver_kwds=driver_kwds,
    512     storage_options=storage_options,
    513 )
    515 store_entrypoint = StoreBackendEntrypoint()
    517 ds = store_entrypoint.open_dataset(
    518     store,
    519     mask_and_scale=mask_and_scale,
   (...)    525     decode_timedelta=decode_timedelta,
    526 )

File ~/checkouts/readthedocs.org/user_builds/clisops/conda/latest/lib/python3.12/site-packages/xarray/backends/h5netcdf_.py:226, in H5NetCDFStore.open(cls, filename, mode, format, group, lock, autoclose, invalid_netcdf, phony_dims, decode_vlen_strings, driver, driver_kwds, storage_options)
    220 manager_cls = (
    221     CachingFileManager
    222     if isinstance(filename, str) and not is_remote_uri(filename)
    223     else PickleableFileManager
    224 )
    225 manager = manager_cls(h5netcdf.File, filename, mode=mode, kwargs=kwargs)
--> 226 return cls(manager, group=group, mode=mode, lock=lock, autoclose=autoclose)

File ~/checkouts/readthedocs.org/user_builds/clisops/conda/latest/lib/python3.12/site-packages/xarray/backends/h5netcdf_.py:149, in H5NetCDFStore.__init__(self, manager, group, mode, lock, autoclose)
    146 self.format = None
    147 # todo: utilizing find_root_and_group seems a bit clunky
    148 #  making filename available on h5netcdf.Group seems better
--> 149 self._filename = find_root_and_group(self.ds)[0].filename
    150 self.is_remote = is_remote_uri(self._filename)
    151 self.lock = ensure_lock(lock)

File ~/checkouts/readthedocs.org/user_builds/clisops/conda/latest/lib/python3.12/site-packages/xarray/backends/h5netcdf_.py:237, in H5NetCDFStore.ds(self)
    235 @property
    236 def ds(self):
--> 237     return self._acquire()

File ~/checkouts/readthedocs.org/user_builds/clisops/conda/latest/lib/python3.12/site-packages/xarray/backends/h5netcdf_.py:229, in H5NetCDFStore._acquire(self, needs_lock)
    228 def _acquire(self, needs_lock=True):
--> 229     with self._manager.acquire_context(needs_lock) as root:
    230         ds = _nc4_require_group(
    231             root, self._group, self._mode, create_group=_h5netcdf_create_group
    232         )
    233     return ds

File ~/checkouts/readthedocs.org/user_builds/clisops/conda/latest/lib/python3.12/contextlib.py:137, in _GeneratorContextManager.__enter__(self)
    135 del self.args, self.kwds, self.func
    136 try:
--> 137     return next(self.gen)
    138 except StopIteration:
    139     raise RuntimeError("generator didn't yield") from None

File ~/checkouts/readthedocs.org/user_builds/clisops/conda/latest/lib/python3.12/site-packages/xarray/backends/file_manager.py:207, in CachingFileManager.acquire_context(self, needs_lock)
    204 @contextmanager
    205 def acquire_context(self, needs_lock: bool = True) -> Iterator[T_File]:
    206     """Context manager for acquiring a file."""
--> 207     file, cached = self._acquire_with_cache_info(needs_lock)
    208     try:
    209         yield file

File ~/checkouts/readthedocs.org/user_builds/clisops/conda/latest/lib/python3.12/site-packages/xarray/backends/file_manager.py:225, in CachingFileManager._acquire_with_cache_info(self, needs_lock)
    223     kwargs = kwargs.copy()
    224     kwargs["mode"] = self._mode
--> 225 file = self._opener(*self._args, **kwargs)
    226 if self._mode == "w":
    227     # ensure file doesn't get overridden when opened again
    228     self._mode = "a"

File ~/checkouts/readthedocs.org/user_builds/clisops/conda/latest/lib/python3.12/site-packages/h5netcdf/core.py:1907, in File.__init__(self, path, mode, format, invalid_netcdf, phony_dims, backend, **kwargs)
   1905     else:  # default h5py
   1906         self._h5py = h5py
-> 1907         self.__h5file, self._preexisting_file, self._close_h5file = _open_h5py(
   1908             path, mode, **kwargs
   1909         )
   1911 except Exception:
   1912     self._closed = True

File ~/checkouts/readthedocs.org/user_builds/clisops/conda/latest/lib/python3.12/site-packages/h5netcdf/core.py:1800, in _open_h5py(path, mode, **kwargs)
   1796 if isinstance(path, str):
   1797     exists = path.startswith(("http", "s3://")) or (
   1798         os.path.exists(path) and mode != "w"
   1799     )
-> 1800     h5file = h5py.File(path, mode, **kwargs)
   1801     return h5file, exists, True
   1802 elif isinstance(path, h5py.File):
   1803     # already-open file

File ~/checkouts/readthedocs.org/user_builds/clisops/conda/latest/lib/python3.12/site-packages/h5py/_hl/files.py:555, in File.__init__(self, name, mode, driver, libver, userblock_size, swmr, rdcc_nslots, rdcc_nbytes, rdcc_w0, track_order, fs_strategy, fs_persist, fs_threshold, fs_page_size, page_buf_size, min_meta_keep, min_raw_keep, locking, alignment_threshold, alignment_interval, meta_block_size, track_times, **kwds)
    546     fapl = make_fapl(driver, libver, rdcc_nslots, rdcc_nbytes, rdcc_w0,
    547                      locking, page_buf_size, min_meta_keep, min_raw_keep,
    548                      alignment_threshold=alignment_threshold,
    549                      alignment_interval=alignment_interval,
    550                      meta_block_size=meta_block_size,
    551                      **kwds)
    552     fcpl = make_fcpl(track_order=track_order, track_times=track_times,
    553                      fs_strategy=fs_strategy, fs_persist=fs_persist,
    554                      fs_threshold=fs_threshold, fs_page_size=fs_page_size)
--> 555     fid = make_fid(name, mode, userblock_size, fapl, fcpl, swmr=swmr)
    557 if isinstance(libver, tuple):
    558     self._libver = libver

File ~/checkouts/readthedocs.org/user_builds/clisops/conda/latest/lib/python3.12/site-packages/h5py/_hl/files.py:232, in make_fid(name, mode, userblock_size, fapl, fcpl, swmr)
    230     if swmr:
    231         flags |= h5f.ACC_SWMR_READ
--> 232     fid = h5f.open(name, flags, fapl=fapl)
    233 elif mode == 'r+':
    234     fid = h5f.open(name, h5f.ACC_RDWR, fapl=fapl)

File h5py/_objects.pyx:54, in h5py._objects.with_phil.wrapper()
---> 54 'Could not get source, probably due dynamically evaluated source code.'

File h5py/_objects.pyx:55, in h5py._objects.with_phil.wrapper()
---> 55 'Could not get source, probably due dynamically evaluated source code.'

File h5py/h5f.pyx:106, in h5py.h5f.open()
--> 106 'Could not get source, probably due dynamically evaluated source code.'

FileNotFoundError: [Errno 2] Unable to synchronously open file (unable to open file: name = '/home/docs/.cache/mini-esgf-data/v1/pool/data/CORDEX/data/cordex/output/EUR-22/GERICS/MPI-M-MPI-ESM-LR/rcp85/r1i1p1/GERICS-REMO2015/v1/mon/tas/v20191029/tas_EUR-22_MPI-M-MPI-ESM-LR_rcp85_r1i1p1_GERICS-REMO2015_v1_mon_202101.nc', errno = 2, error message = 'No such file or directory', flags = 0, o_flags = 0)
Take a look at the grid
[8]:
plt.figure(figsize=(8, 5))
plt.scatter(ds_cordex["lon"][::4, ::4], ds_cordex["lat"][::4, ::4], s=0.1)
plt.xlabel("lon")
plt.ylabel("lat")
---------------------------------------------------------------------------
NameError                                 Traceback (most recent call last)
Cell In[8], line 2
      1 plt.figure(figsize=(8, 5))
----> 2 plt.scatter(ds_cordex["lon"][::4, ::4], ds_cordex["lat"][::4, ::4], s=0.1)
      3 plt.xlabel("lon")
      4 plt.ylabel("lat")

NameError: name 'ds_cordex' is not defined
<Figure size 800x500 with 0 Axes>
Remap to regional regular lat-lon grid of adaptive resolution with the bilinear method
[9]:
ds_remap = clops.regrid(ds_cordex, method="bilinear", grid="adaptive", output_type="xarray")[0]
ds_remap
---------------------------------------------------------------------------
NameError                                 Traceback (most recent call last)
Cell In[9], line 1
----> 1 ds_remap = clops.regrid(ds_cordex, method="bilinear", grid="adaptive", output_type="xarray")[0]
      2 ds_remap

NameError: name 'ds_cordex' is not defined
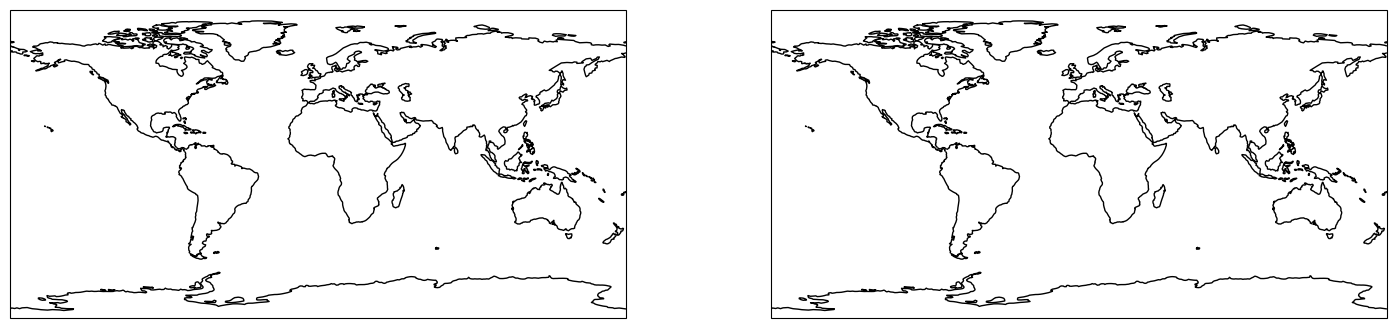
Plot the remapped data next to the source data
[10]:
fig, axes = plt.subplots(ncols=2, figsize=(18, 4), subplot_kw={"projection": ccrs.PlateCarree()})
for ax in axes:
    ax.coastlines()

# Source data
ds_cordex.tas.isel(time=0).plot.pcolormesh(ax=axes[0], x="lon", y="lat", shading="auto", cmap="RdBu_r")
axes[0].title.set_text("Source - GERICS-REMO2015 (EUR22, ~0.22° resolution)")
# Remapped data
ds_remap.tas.isel(time=0).plot.pcolormesh(ax=axes[1], x="lon", y="lat", shading="auto", cmap="RdBu_r")
axes[1].title.set_text("Target - regional regular lat-lon (adaptive resolution)")
---------------------------------------------------------------------------
NameError                                 Traceback (most recent call last)
Cell In[10], line 6
      2 for ax in axes:
      3     ax.coastlines()
      4
      5 # Source data
----> 6 ds_cordex.tas.isel(time=0).plot.pcolormesh(ax=axes[0], x="lon", y="lat", shading="auto", cmap="RdBu_r")
      7 axes[0].title.set_text("Source - GERICS-REMO2015 (EUR22, ~0.22° resolution)")
      8 # Remapped data
      9 ds_remap.tas.isel(time=0).plot.pcolormesh(ax=axes[1], x="lon", y="lat", shading="auto", cmap="RdBu_r")

NameError: name 'ds_cordex' is not defined

Remap unstructured xarray.Dataset to a global grid of adaptive resolution using the nearest neighbour method
For unstructured grids, at least for the moment, only the nearest neighbour remapping method is supported.
Load the dataset
[11]:
ds_icono = xr.open_dataset(mini_esgf_data["CMIP6_UNSTR_VERT_ICON_O"])
ds_icono
---------------------------------------------------------------------------
KeyError                                  Traceback (most recent call last)
File ~/checkouts/readthedocs.org/user_builds/clisops/conda/latest/lib/python3.12/site-packages/xarray/backends/file_manager.py:219, in CachingFileManager._acquire_with_cache_info(self, needs_lock)
    218 try:
--> 219     file = self._cache[self._key]
    220 except KeyError:

File ~/checkouts/readthedocs.org/user_builds/clisops/conda/latest/lib/python3.12/site-packages/xarray/backends/lru_cache.py:56, in LRUCache.__getitem__(self, key)
     55 with self._lock:
---> 56     value = self._cache[key]
     57     self._cache.move_to_end(key)

KeyError: [<class 'h5netcdf.core.File'>, ('/home/docs/.cache/mini-esgf-data/v1/badc/cmip6/data/CMIP6/CMIP/MPI-M/ICON-ESM-LR/historical/r1i1p1f1/Omon/thetao/gn/v20210215/thetao_Omon_ICON-ESM-LR_historical_r1i1p1f1_gn_185001.nc',), 'r', (('decode_vlen_strings', True), ('driver', None), ('invalid_netcdf', None), ('phony_dims', 'access')), '81cd9f86-ab8a-40f9-a092-751a5448b9f6']

During handling of the above exception, another exception occurred:

FileNotFoundError                         Traceback (most recent call last)
Cell In[11], line 1
----> 1 ds_icono = xr.open_dataset(mini_esgf_data["CMIP6_UNSTR_VERT_ICON_O"])
      2 ds_icono

File ~/checkouts/readthedocs.org/user_builds/clisops/conda/latest/lib/python3.12/site-packages/xarray/backends/api.py:596, in open_dataset(filename_or_obj, engine, chunks, cache, decode_cf, mask_and_scale, decode_times, decode_timedelta, use_cftime, concat_characters, decode_coords, drop_variables, create_default_indexes, inline_array, chunked_array_type, from_array_kwargs, backend_kwargs, **kwargs)
    584 decoders = _resolve_decoders_kwargs(
    585     decode_cf,
    586     open_backend_dataset_parameters=backend.open_dataset_parameters,
   (...)    592     decode_coords=decode_coords,
    593 )
    595 overwrite_encoded_chunks = kwargs.pop("overwrite_encoded_chunks", None)
--> 596 backend_ds = backend.open_dataset(
    597     filename_or_obj,
    598     drop_variables=drop_variables,
    599     **decoders,
    600     **kwargs,
    601 )
    602 ds = _dataset_from_backend_dataset(
    603     backend_ds,
    604     filename_or_obj,
   (...)    615     **kwargs,
    616 )
    617 return ds

File ~/checkouts/readthedocs.org/user_builds/clisops/conda/latest/lib/python3.12/site-packages/xarray/backends/h5netcdf_.py:502, in H5netcdfBackendEntrypoint.open_dataset(self, filename_or_obj, mask_and_scale, decode_times, concat_characters, decode_coords, drop_variables, use_cftime, decode_timedelta, format, group, lock, invalid_netcdf, phony_dims, decode_vlen_strings, driver, driver_kwds, storage_options)
    499 emit_phony_dims_warning, phony_dims = _check_phony_dims(phony_dims)
    501 filename_or_obj = _normalize_filename_or_obj(filename_or_obj)
--> 502 store = H5NetCDFStore.open(
    503     filename_or_obj,
    504     format=format,
    505     group=group,
    506     lock=lock,
    507     invalid_netcdf=invalid_netcdf,
    508     phony_dims=phony_dims,
    509     decode_vlen_strings=decode_vlen_strings,
    510     driver=driver,
    511     driver_kwds=driver_kwds,
    512     storage_options=storage_options,
    513 )
    515 store_entrypoint = StoreBackendEntrypoint()
    517 ds = store_entrypoint.open_dataset(
    518     store,
    519     mask_and_scale=mask_and_scale,
   (...)    525     decode_timedelta=decode_timedelta,
    526 )

File ~/checkouts/readthedocs.org/user_builds/clisops/conda/latest/lib/python3.12/site-packages/xarray/backends/h5netcdf_.py:226, in H5NetCDFStore.open(cls, filename, mode, format, group, lock, autoclose, invalid_netcdf, phony_dims, decode_vlen_strings, driver, driver_kwds, storage_options)
    220 manager_cls = (
    221     CachingFileManager
    222     if isinstance(filename, str) and not is_remote_uri(filename)
    223     else PickleableFileManager
    224 )
    225 manager = manager_cls(h5netcdf.File, filename, mode=mode, kwargs=kwargs)
--> 226 return cls(manager, group=group, mode=mode, lock=lock, autoclose=autoclose)

File ~/checkouts/readthedocs.org/user_builds/clisops/conda/latest/lib/python3.12/site-packages/xarray/backends/h5netcdf_.py:149, in H5NetCDFStore.__init__(self, manager, group, mode, lock, autoclose)
    146 self.format = None
    147 # todo: utilizing find_root_and_group seems a bit clunky
    148 #  making filename available on h5netcdf.Group seems better
--> 149 self._filename = find_root_and_group(self.ds)[0].filename
    150 self.is_remote = is_remote_uri(self._filename)
    151 self.lock = ensure_lock(lock)

File ~/checkouts/readthedocs.org/user_builds/clisops/conda/latest/lib/python3.12/site-packages/xarray/backends/h5netcdf_.py:237, in H5NetCDFStore.ds(self)
    235 @property
    236 def ds(self):
--> 237     return self._acquire()

File ~/checkouts/readthedocs.org/user_builds/clisops/conda/latest/lib/python3.12/site-packages/xarray/backends/h5netcdf_.py:229, in H5NetCDFStore._acquire(self, needs_lock)
    228 def _acquire(self, needs_lock=True):
--> 229     with self._manager.acquire_context(needs_lock) as root:
    230         ds = _nc4_require_group(
    231             root, self._group, self._mode, create_group=_h5netcdf_create_group
    232         )
    233     return ds

File ~/checkouts/readthedocs.org/user_builds/clisops/conda/latest/lib/python3.12/contextlib.py:137, in _GeneratorContextManager.__enter__(self)
    135 del self.args, self.kwds, self.func
    136 try:
--> 137     return next(self.gen)
    138 except StopIteration:
    139     raise RuntimeError("generator didn't yield") from None

File ~/checkouts/readthedocs.org/user_builds/clisops/conda/latest/lib/python3.12/site-packages/xarray/backends/file_manager.py:207, in CachingFileManager.acquire_context(self, needs_lock)
    204 @contextmanager
    205 def acquire_context(self, needs_lock: bool = True) -> Iterator[T_File]:
    206     """Context manager for acquiring a file."""
--> 207     file, cached = self._acquire_with_cache_info(needs_lock)
    208     try:
    209         yield file

File ~/checkouts/readthedocs.org/user_builds/clisops/conda/latest/lib/python3.12/site-packages/xarray/backends/file_manager.py:225, in CachingFileManager._acquire_with_cache_info(self, needs_lock)
    223     kwargs = kwargs.copy()
    224     kwargs["mode"] = self._mode
--> 225 file = self._opener(*self._args, **kwargs)
    226 if self._mode == "w":
    227     # ensure file doesn't get overridden when opened again
    228     self._mode = "a"

File ~/checkouts/readthedocs.org/user_builds/clisops/conda/latest/lib/python3.12/site-packages/h5netcdf/core.py:1907, in File.__init__(self, path, mode, format, invalid_netcdf, phony_dims, backend, **kwargs)
   1905     else:  # default h5py
   1906         self._h5py = h5py
-> 1907         self.__h5file, self._preexisting_file, self._close_h5file = _open_h5py(
   1908             path, mode, **kwargs
   1909         )
   1911 except Exception:
   1912     self._closed = True

File ~/checkouts/readthedocs.org/user_builds/clisops/conda/latest/lib/python3.12/site-packages/h5netcdf/core.py:1800, in _open_h5py(path, mode, **kwargs)
   1796 if isinstance(path, str):
   1797     exists = path.startswith(("http", "s3://")) or (
   1798         os.path.exists(path) and mode != "w"
   1799     )
-> 1800     h5file = h5py.File(path, mode, **kwargs)
   1801     return h5file, exists, True
   1802 elif isinstance(path, h5py.File):
   1803     # already-open file

File ~/checkouts/readthedocs.org/user_builds/clisops/conda/latest/lib/python3.12/site-packages/h5py/_hl/files.py:555, in File.__init__(self, name, mode, driver, libver, userblock_size, swmr, rdcc_nslots, rdcc_nbytes, rdcc_w0, track_order, fs_strategy, fs_persist, fs_threshold, fs_page_size, page_buf_size, min_meta_keep, min_raw_keep, locking, alignment_threshold, alignment_interval, meta_block_size, track_times, **kwds)
    546     fapl = make_fapl(driver, libver, rdcc_nslots, rdcc_nbytes, rdcc_w0,
    547                      locking, page_buf_size, min_meta_keep, min_raw_keep,
    548                      alignment_threshold=alignment_threshold,
    549                      alignment_interval=alignment_interval,
    550                      meta_block_size=meta_block_size,
    551                      **kwds)
    552     fcpl = make_fcpl(track_order=track_order, track_times=track_times,
    553                      fs_strategy=fs_strategy, fs_persist=fs_persist,
    554                      fs_threshold=fs_threshold, fs_page_size=fs_page_size)
--> 555     fid = make_fid(name, mode, userblock_size, fapl, fcpl, swmr=swmr)
    557 if isinstance(libver, tuple):
    558     self._libver = libver

File ~/checkouts/readthedocs.org/user_builds/clisops/conda/latest/lib/python3.12/site-packages/h5py/_hl/files.py:232, in make_fid(name, mode, userblock_size, fapl, fcpl, swmr)
    230     if swmr:
    231         flags |= h5f.ACC_SWMR_READ
--> 232     fid = h5f.open(name, flags, fapl=fapl)
    233 elif mode == 'r+':
    234     fid = h5f.open(name, h5f.ACC_RDWR, fapl=fapl)

File h5py/_objects.pyx:54, in h5py._objects.with_phil.wrapper()
---> 54 'Could not get source, probably due dynamically evaluated source code.'

File h5py/_objects.pyx:55, in h5py._objects.with_phil.wrapper()
---> 55 'Could not get source, probably due dynamically evaluated source code.'

File h5py/h5f.pyx:106, in h5py.h5f.open()
--> 106 'Could not get source, probably due dynamically evaluated source code.'

FileNotFoundError: [Errno 2] Unable to synchronously open file (unable to open file: name = '/home/docs/.cache/mini-esgf-data/v1/badc/cmip6/data/CMIP6/CMIP/MPI-M/ICON-ESM-LR/historical/r1i1p1f1/Omon/thetao/gn/v20210215/thetao_Omon_ICON-ESM-LR_historical_r1i1p1f1_gn_185001.nc', errno = 2, error message = 'No such file or directory', flags = 0, o_flags = 0)
Take a look at the grid
[12]:
plt.figure(figsize=(16, 9))
plt.scatter(ds_icono["longitude"][::2], ds_icono["latitude"][::2], s=0.05)
plt.xlabel("lon")
plt.ylabel("lat")
---------------------------------------------------------------------------
NameError                                 Traceback (most recent call last)
Cell In[12], line 2
      1 plt.figure(figsize=(16, 9))
----> 2 plt.scatter(ds_icono["longitude"][::2], ds_icono["latitude"][::2], s=0.05)
      3 plt.xlabel("lon")
      4 plt.ylabel("lat")

NameError: name 'ds_icono' is not defined
<Figure size 1600x900 with 0 Axes>
Remap to global grid of adaptive resolution with the nearest neighbour method
[13]:
ds_remap = clops.regrid(ds_icono, method="nearest_s2d", grid="adaptive", output_type="xarray")[0]
ds_remap
---------------------------------------------------------------------------
NameError                                 Traceback (most recent call last)
Cell In[13], line 1
----> 1 ds_remap = clops.regrid(ds_icono, method="nearest_s2d", grid="adaptive", output_type="xarray")[0]
      2 ds_remap

NameError: name 'ds_icono' is not defined
Plot source data and remapped data
Below we use matplotlib to plot the data on the unstructured ICON-Grid, which requires some processing of the cell bounds. Using psyplot to plot the unstructured data is a simpler alternative. psyplot / psymaps is however not included in the clisops dependencies as it comes with complex dependencies itself.
# Source data - psyplot
ds_icono_path = ds_icono.encoding["source"]
maps = psy.plot.mapplot(
    ds_icono_path,
    cmap="RdBu_r",
    title="Source - ICON-ESM-LR ICON-O (Ruby-0, 40km resolution)",
    time=[0],
    lev=[0]
)
[14]:
# Source data

# Function to fix cell_bounds crossing the meridian
#   to avoid horizontal lines in the plot
def fix_meridian_crossing(lon_bnds, lat_bnds):
    """Shift longitudes from -180,180 to 0,360."""
    fixed_lon = []
    fixed_lat = []
    for lon, lat in zip(lon_bnds, lat_bnds, strict=False):
        lon = np.array(lon)
        lat = np.array(lat)
        lon_range = lon.max() - lon.min()
        if lon_range > 180:  # crosses meridian
            # Shift longitudes < 180 by +360
            lon_corrected = np.where(lon < 180, lon + 360, lon)
        else:
            lon_corrected = lon
        fixed_lon.append(lon_corrected)
        fixed_lat.append(lat)
    return np.array(fixed_lon), np.array(fixed_lat)


fixed_lon, fixed_lat = fix_meridian_crossing(ds_icono.longitude_bnds.values, ds_icono.latitude_bnds.values)
---------------------------------------------------------------------------
NameError                                 Traceback (most recent call last)
Cell In[14], line 23
     19         fixed_lat.append(lat)
     20     return np.array(fixed_lon), np.array(fixed_lat)
     21
     22
---> 23 fixed_lon, fixed_lat = fix_meridian_crossing(ds_icono.longitude_bnds.values, ds_icono.latitude_bnds.values)

NameError: name 'ds_icono' is not defined
[15]:
# Source data
fig, ax = plt.subplots(subplot_kw={"projection": ccrs.PlateCarree()}, figsize=(10, 6))

# Plot as collection of polygons
pc = PolyCollection(
    [list(zip(*lonlat, strict=False)) for lonlat in zip(fixed_lon, fixed_lat, strict=False)],
    array=ds_icono["thetao"].isel(time=0, lev=0).values.squeeze(),
    cmap="RdBu_r",
    edgecolor="face",
    transform=ccrs.PlateCarree(),
)
ax.add_collection(pc)

# Adjust colorbar, title, labels and ticks
xticks = range(-180, 181, 60)
yticks = range(-90, 91, 30)
ax.set_xticks(xticks, crs=ccrs.PlateCarree())
ax.set_yticks(yticks, crs=ccrs.PlateCarree())
ax.set_xlabel("Longitude", fontsize=12)
ax.set_ylabel("Latitude", fontsize=12)
ax.autoscale()
ax.coastlines(resolution="10m")
fig.colorbar(pc, ax=ax, label="thetao", shrink=0.6)
fig.suptitle("Source - ICON-ESM-LR ICON-O (Ruby-0, 40km resolution)", fontsize=14, x=0.45, y=0.8)

plt.show()
---------------------------------------------------------------------------
NameError                                 Traceback (most recent call last)
Cell In[15], line 6
      2 fig, ax = plt.subplots(subplot_kw={"projection": ccrs.PlateCarree()}, figsize=(10, 6))
      3
      4 # Plot as collection of polygons
      5 pc = PolyCollection(
----> 6     [list(zip(*lonlat, strict=False)) for lonlat in zip(fixed_lon, fixed_lat, strict=False)],
      7     array=ds_icono["thetao"].isel(time=0, lev=0).values.squeeze(),
      8     cmap="RdBu_r",
      9     edgecolor="face",

NameError: name 'fixed_lon' is not defined
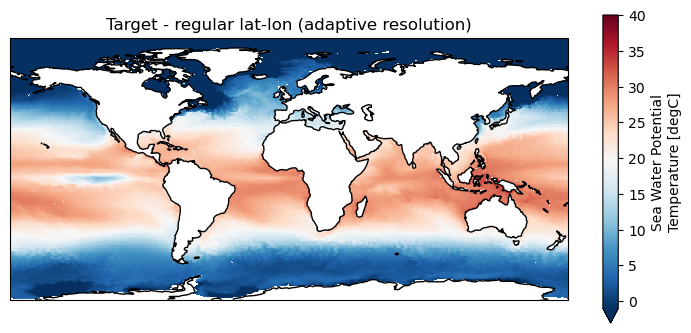
[16]:
# Remapped data
plt.figure(figsize=(9, 4))
ax = plt.axes(projection=ccrs.PlateCarree())
ds_remap.thetao.isel(time=0, lev=0).plot.pcolormesh(
    ax=ax, x="lon", y="lat", shading="auto", cmap="RdBu_r", vmin=-1, vmax=40
)
ax.title.set_text("Target - regular lat-lon (adaptive resolution)")
ax.coastlines()
---------------------------------------------------------------------------
NameError                                 Traceback (most recent call last)
Cell In[16], line 4
      1 # Remapped data
      2 plt.figure(figsize=(9, 4))
      3 ax = plt.axes(projection=ccrs.PlateCarree())
----> 4 ds_remap.thetao.isel(time=0, lev=0).plot.pcolormesh(
      5     ax=ax, x="lon", y="lat", shading="auto", cmap="RdBu_r", vmin=-1, vmax=40
      6 )
      7 ax.title.set_text("Target - regular lat-lon (adaptive resolution)")

NameError: name 'ds_remap' is not defined

clisops.core.Grid
Create a grid object from an xarray.Dataset
Load the dataset
[17]:
dso = xr.open_dataset(mini_esgf_data["CMIP6_TOS_ONE_TIME_STEP"])
dso
---------------------------------------------------------------------------
KeyError                                  Traceback (most recent call last)
File ~/checkouts/readthedocs.org/user_builds/clisops/conda/latest/lib/python3.12/site-packages/xarray/backends/file_manager.py:219, in CachingFileManager._acquire_with_cache_info(self, needs_lock)
    218 try:
--> 219     file = self._cache[self._key]
    220 except KeyError:

File ~/checkouts/readthedocs.org/user_builds/clisops/conda/latest/lib/python3.12/site-packages/xarray/backends/lru_cache.py:56, in LRUCache.__getitem__(self, key)
     55 with self._lock:
---> 56     value = self._cache[key]
     57     self._cache.move_to_end(key)

KeyError: [<class 'h5netcdf.core.File'>, ('/home/docs/.cache/mini-esgf-data/v1/badc/cmip6/data/CMIP6/CMIP/MPI-M/MPI-ESM1-2-HR/historical/r1i1p1f1/Omon/tos/gn/v20190710/tos_Omon_MPI-ESM1-2-HR_historical_r1i1p1f1_gn_185001.nc',), 'r', (('decode_vlen_strings', True), ('driver', None), ('invalid_netcdf', None), ('phony_dims', 'access')), '3056c70a-d398-4cff-ad3b-fea0fef6909c']

During handling of the above exception, another exception occurred:

FileNotFoundError                         Traceback (most recent call last)
Cell In[17], line 1
----> 1 dso = xr.open_dataset(mini_esgf_data["CMIP6_TOS_ONE_TIME_STEP"])
      2 dso

File ~/checkouts/readthedocs.org/user_builds/clisops/conda/latest/lib/python3.12/site-packages/xarray/backends/api.py:596, in open_dataset(filename_or_obj, engine, chunks, cache, decode_cf, mask_and_scale, decode_times, decode_timedelta, use_cftime, concat_characters, decode_coords, drop_variables, create_default_indexes, inline_array, chunked_array_type, from_array_kwargs, backend_kwargs, **kwargs)
    584 decoders = _resolve_decoders_kwargs(
    585     decode_cf,
    586     open_backend_dataset_parameters=backend.open_dataset_parameters,
   (...)    592     decode_coords=decode_coords,
    593 )
    595 overwrite_encoded_chunks = kwargs.pop("overwrite_encoded_chunks", None)
--> 596 backend_ds = backend.open_dataset(
    597     filename_or_obj,
    598     drop_variables=drop_variables,
    599     **decoders,
    600     **kwargs,
    601 )
    602 ds = _dataset_from_backend_dataset(
    603     backend_ds,
    604     filename_or_obj,
   (...)    615     **kwargs,
    616 )
    617 return ds

File ~/checkouts/readthedocs.org/user_builds/clisops/conda/latest/lib/python3.12/site-packages/xarray/backends/h5netcdf_.py:502, in H5netcdfBackendEntrypoint.open_dataset(self, filename_or_obj, mask_and_scale, decode_times, concat_characters, decode_coords, drop_variables, use_cftime, decode_timedelta, format, group, lock, invalid_netcdf, phony_dims, decode_vlen_strings, driver, driver_kwds, storage_options)
    499 emit_phony_dims_warning, phony_dims = _check_phony_dims(phony_dims)
    501 filename_or_obj = _normalize_filename_or_obj(filename_or_obj)
--> 502 store = H5NetCDFStore.open(
    503     filename_or_obj,
    504     format=format,
    505     group=group,
    506     lock=lock,
    507     invalid_netcdf=invalid_netcdf,
    508     phony_dims=phony_dims,
    509     decode_vlen_strings=decode_vlen_strings,
    510     driver=driver,
    511     driver_kwds=driver_kwds,
    512     storage_options=storage_options,
    513 )
    515 store_entrypoint = StoreBackendEntrypoint()
    517 ds = store_entrypoint.open_dataset(
    518     store,
    519     mask_and_scale=mask_and_scale,
   (...)    525     decode_timedelta=decode_timedelta,
    526 )

File ~/checkouts/readthedocs.org/user_builds/clisops/conda/latest/lib/python3.12/site-packages/xarray/backends/h5netcdf_.py:226, in H5NetCDFStore.open(cls, filename, mode, format, group, lock, autoclose, invalid_netcdf, phony_dims, decode_vlen_strings, driver, driver_kwds, storage_options)
    220 manager_cls = (
    221     CachingFileManager
    222     if isinstance(filename, str) and not is_remote_uri(filename)
    223     else PickleableFileManager
    224 )
    225 manager = manager_cls(h5netcdf.File, filename, mode=mode, kwargs=kwargs)
--> 226 return cls(manager, group=group, mode=mode, lock=lock, autoclose=autoclose)

File ~/checkouts/readthedocs.org/user_builds/clisops/conda/latest/lib/python3.12/site-packages/xarray/backends/h5netcdf_.py:149, in H5NetCDFStore.__init__(self, manager, group, mode, lock, autoclose)
    146 self.format = None
    147 # todo: utilizing find_root_and_group seems a bit clunky
    148 #  making filename available on h5netcdf.Group seems better
--> 149 self._filename = find_root_and_group(self.ds)[0].filename
    150 self.is_remote = is_remote_uri(self._filename)
    151 self.lock = ensure_lock(lock)

File ~/checkouts/readthedocs.org/user_builds/clisops/conda/latest/lib/python3.12/site-packages/xarray/backends/h5netcdf_.py:237, in H5NetCDFStore.ds(self)
    235 @property
    236 def ds(self):
--> 237     return self._acquire()

File ~/checkouts/readthedocs.org/user_builds/clisops/conda/latest/lib/python3.12/site-packages/xarray/backends/h5netcdf_.py:229, in H5NetCDFStore._acquire(self, needs_lock)
    228 def _acquire(self, needs_lock=True):
--> 229     with self._manager.acquire_context(needs_lock) as root:
    230         ds = _nc4_require_group(
    231             root, self._group, self._mode, create_group=_h5netcdf_create_group
    232         )
    233     return ds

File ~/checkouts/readthedocs.org/user_builds/clisops/conda/latest/lib/python3.12/contextlib.py:137, in _GeneratorContextManager.__enter__(self)
    135 del self.args, self.kwds, self.func
    136 try:
--> 137     return next(self.gen)
    138 except StopIteration:
    139     raise RuntimeError("generator didn't yield") from None

File ~/checkouts/readthedocs.org/user_builds/clisops/conda/latest/lib/python3.12/site-packages/xarray/backends/file_manager.py:207, in CachingFileManager.acquire_context(self, needs_lock)
    204 @contextmanager
    205 def acquire_context(self, needs_lock: bool = True) -> Iterator[T_File]:
    206     """Context manager for acquiring a file."""
--> 207     file, cached = self._acquire_with_cache_info(needs_lock)
    208     try:
    209         yield file

File ~/checkouts/readthedocs.org/user_builds/clisops/conda/latest/lib/python3.12/site-packages/xarray/backends/file_manager.py:225, in CachingFileManager._acquire_with_cache_info(self, needs_lock)
    223     kwargs = kwargs.copy()
    224     kwargs["mode"] = self._mode
--> 225 file = self._opener(*self._args, **kwargs)
    226 if self._mode == "w":
    227     # ensure file doesn't get overridden when opened again
    228     self._mode = "a"

File ~/checkouts/readthedocs.org/user_builds/clisops/conda/latest/lib/python3.12/site-packages/h5netcdf/core.py:1907, in File.__init__(self, path, mode, format, invalid_netcdf, phony_dims, backend, **kwargs)
   1905     else:  # default h5py
   1906         self._h5py = h5py
-> 1907         self.__h5file, self._preexisting_file, self._close_h5file = _open_h5py(
   1908             path, mode, **kwargs
   1909         )
   1911 except Exception:
   1912     self._closed = True

File ~/checkouts/readthedocs.org/user_builds/clisops/conda/latest/lib/python3.12/site-packages/h5netcdf/core.py:1800, in _open_h5py(path, mode, **kwargs)
   1796 if isinstance(path, str):
   1797     exists = path.startswith(("http", "s3://")) or (
   1798         os.path.exists(path) and mode != "w"
   1799     )
-> 1800     h5file = h5py.File(path, mode, **kwargs)
   1801     return h5file, exists, True
   1802 elif isinstance(path, h5py.File):
   1803     # already-open file

File ~/checkouts/readthedocs.org/user_builds/clisops/conda/latest/lib/python3.12/site-packages/h5py/_hl/files.py:555, in File.__init__(self, name, mode, driver, libver, userblock_size, swmr, rdcc_nslots, rdcc_nbytes, rdcc_w0, track_order, fs_strategy, fs_persist, fs_threshold, fs_page_size, page_buf_size, min_meta_keep, min_raw_keep, locking, alignment_threshold, alignment_interval, meta_block_size, track_times, **kwds)
    546     fapl = make_fapl(driver, libver, rdcc_nslots, rdcc_nbytes, rdcc_w0,
    547                      locking, page_buf_size, min_meta_keep, min_raw_keep,
    548                      alignment_threshold=alignment_threshold,
    549                      alignment_interval=alignment_interval,
    550                      meta_block_size=meta_block_size,
    551                      **kwds)
    552     fcpl = make_fcpl(track_order=track_order, track_times=track_times,
    553                      fs_strategy=fs_strategy, fs_persist=fs_persist,
    554                      fs_threshold=fs_threshold, fs_page_size=fs_page_size)
--> 555     fid = make_fid(name, mode, userblock_size, fapl, fcpl, swmr=swmr)
    557 if isinstance(libver, tuple):
    558     self._libver = libver

File ~/checkouts/readthedocs.org/user_builds/clisops/conda/latest/lib/python3.12/site-packages/h5py/_hl/files.py:232, in make_fid(name, mode, userblock_size, fapl, fcpl, swmr)
    230     if swmr:
    231         flags |= h5f.ACC_SWMR_READ
--> 232     fid = h5f.open(name, flags, fapl=fapl)
    233 elif mode == 'r+':
    234     fid = h5f.open(name, h5f.ACC_RDWR, fapl=fapl)

File h5py/_objects.pyx:54, in h5py._objects.with_phil.wrapper()
---> 54 'Could not get source, probably due dynamically evaluated source code.'

File h5py/_objects.pyx:55, in h5py._objects.with_phil.wrapper()
---> 55 'Could not get source, probably due dynamically evaluated source code.'

File h5py/h5f.pyx:106, in h5py.h5f.open()
--> 106 'Could not get source, probably due dynamically evaluated source code.'

FileNotFoundError: [Errno 2] Unable to synchronously open file (unable to open file: name = '/home/docs/.cache/mini-esgf-data/v1/badc/cmip6/data/CMIP6/CMIP/MPI-M/MPI-ESM1-2-HR/historical/r1i1p1f1/Omon/tos/gn/v20190710/tos_Omon_MPI-ESM1-2-HR_historical_r1i1p1f1_gn_185001.nc', errno = 2, error message = 'No such file or directory', flags = 0, o_flags = 0)
Create the Grid object
[18]:
grido = clore.Grid(ds=dso)
grido
---------------------------------------------------------------------------
NameError                                 Traceback (most recent call last)
Cell In[18], line 1
----> 1 grido = clore.Grid(ds=dso)
      2 grido

NameError: name 'dso' is not defined
The xarray.Dataset is attached to the clisops.core.Grid object. Auxiliary coordinates and data variables have been (re)set appropriately.
[19]:
grido.ds
---------------------------------------------------------------------------
NameError                                 Traceback (most recent call last)
Cell In[19], line 1
----> 1 grido.ds

NameError: name 'grido' is not defined
Plot the data
[20]:
plt.figure(figsize=(9, 4))
ax = plt.axes(projection=ccrs.PlateCarree())
grido.ds.tos.isel(time=0).plot.pcolormesh(
    ax=ax, x=grido.lon, y=grido.lat, shading="auto", cmap="RdBu_r", vmin=-1, vmax=40
)
ax.coastlines()
---------------------------------------------------------------------------
NameError                                 Traceback (most recent call last)
Cell In[20], line 3
      1 plt.figure(figsize=(9, 4))
      2 ax = plt.axes(projection=ccrs.PlateCarree())
----> 3 grido.ds.tos.isel(time=0).plot.pcolormesh(
      4     ax=ax, x=grido.lon, y=grido.lat, shading="auto", cmap="RdBu_r", vmin=-1, vmax=40
      5 )
      6 ax.coastlines()

NameError: name 'grido' is not defined

Create a grid object from an xarray.DataArray
Note that xarray.DataArray objects do not support the bounds of coordinate variables to be defined.
Extract tos DataArray
[21]:
dao = dso.tos
dao
---------------------------------------------------------------------------
NameError                                 Traceback (most recent call last)
Cell In[21], line 1
----> 1 dao = dso.tos
      2 dao

NameError: name 'dso' is not defined
Create Grid object for MPIOM tos dataarray:
[22]:
grido_tos = clore.Grid(ds=dao)
grido_tos
---------------------------------------------------------------------------
NameError                                 Traceback (most recent call last)
Cell In[22], line 1
----> 1 grido_tos = clore.Grid(ds=dao)
      2 grido_tos

NameError: name 'dao' is not defined
Create a grid object using a grid_instructor
global grid:
grid_instructor = (lon_step, lat_step)orgrid_instructor = stepregional grid:
grid_instructor = (lon_start, lon_end, lon_step, lat_start, lat_end, lat_step)orgrid_instructor = (start, end, step)
[23]:
grid_1deg = clore.Grid(grid_instructor=1)
grid_1deg
[23]:
clisops 180x360_cells_grid
Lat x Lon:        180 x 360
Average resolution (x,y): (np.float64(1.0), np.float64(1.0))
Gridcells:        64800
Format:           CF
Type:             regular_lat_lon
Extent:           global
Extent (x):       global
Extent (y):       global
Source:           xESMF
Bounds?           True
Degenerate cells? False
Duplicated cells? False
Permanent Mask:
md5 hash:         ff485fa62d5f72e2db23980e3c76efa7
[24]:
grid_1degx2deg_regional = clore.Grid(grid_instructor=(0.0, 90.0, 1.0, 35.0, 50.0, 2.0))
grid_1degx2deg_regional
[24]:
clisops 7x90_cells_grid
Lat x Lon:        7 x 90
Average resolution (x,y): (np.float64(1.0), np.float64(2.0))
Gridcells:        630
Format:           CF
Type:             regular_lat_lon
Extent:           regional
Extent (x):       regional
Extent (y):       regional
Source:           xESMF
Bounds?           True
Degenerate cells? False
Duplicated cells? False
Permanent Mask:
md5 hash:         c2ddd1634879f48dfa1bdde053198fcb
Create a grid object using a grid_id
Makes use of the predefined grids of roocs_grids, which is a collection of grids used for example for the IPCC Atlas and for CMIP6 Regridding Weights generation.
[25]:
for key, gridinfo in grid_annotations.items():
    print(f"- {key:20} {gridinfo}")
- 0pt25deg             Global 0.25 degree grid with one cell centered at 0.125E,0.125N
- World_Ocean_Atlas    Global 1.0 degree grid with one cell centered at 0.5E,0.5N. As used by the World Ocean Atlas.
- 1deg                 Global 1.0 degree grid with one cell centered at 0.5E,0.5N. As used by the World Ocean Atlas.
- 2pt5deg              Global 2.5 degree grid with one cell centered at 1.25E,1.25N.
- MERRA-2              Global 0.65x0.5 (latxlon) degree grid with one cell centered at 0E,0N. As used by MERRA-2.
- 0pt625x0pt5deg       Global 0.65x0.5 (latxlon) degree grid with one cell centered at 0E,0N. As used by MERRA-2.
- ERA-Interim          Global 0.75 degree grid with one cell centered at 0E,0N. As used by ERA-Interim.
- 0pt75deg             Global 0.75 degree grid with one cell centered at 0E,0N. As used by ERA-Interim.
- ERA-40               Global 1.25 degree grid with one cell centered at 0E,0N. As used by ERA-40.
- 1pt25deg             Global 1.25 degree grid with one cell centered at 0E,0N. As used by ERA-40.
- ERA5                 Global 0.25 degree grid with one cell centered at 0E,0N. As used by ERA-5.
- 0pt25deg_era5        Global 0.25 degree grid with one cell centered at 0E,0N. As used by ERA-5.
- 0pt25deg_era5_lsm    Global 0.25 degree grid with one cell centered at 0E,0N. As used by ERA-5. Includes a fractional land-sea mask.
- 0pt5deg_lsm          Global 0.5 degree grid with one cell centered at 0.25E,0.25N. Includes a fractional land-sea mask.
- 1deg_lsm             Global 1.0 degree grid with one cell centered at 0.5E,0.5N. As used by the World Ocean Atlas. Includes a fractional land-sea mask.
- 2deg_lsm             Global 2.0 degree grid with one cell centered at 1.0E,1.0N.
- 0pt25deg_era5_lsm_binary Global 0.25 degree grid with one cell centered at 0E,0N. As used by ERA-5. Includes a binary land-sea mask with land/sea fraction cut at >=0.5.
- 1deg_lsm_binary      Global 1.0 degree grid with one cell centered at 0.5E,0.5N. As used by the World Ocean Atlas. Includes a binary land-sea mask with land/sea fraction cut at >=0.5.
- 2deg_lsm_binary      Global 2.0 degree grid with one cell centered at 1.0E,1.0N. Includes a binary land-sea mask with land/sea fraction cut at >=0.5.
- T31                  Gaussian global grid of approx. 3.8 degree resolution, 48x96 nlatxnlon. Associated to a T31 spectral grid representation.
- T42                  Gaussian global grid of approx. 2.8 degree resolution, 64x128 nlatxnlon. Associated to a T42 spectral grid representation.
- T63_lsm_binary       Gaussian global grid of approx. 1.9 degree resolution, 96x192 nlatxnlon. Associated to a T63 spectral grid representation.  Includes a binary land-sea mask.
- T127_lsm_binary      Gaussian global grid of approx. 1.0 degree resolution, 192x384 nlatxnlon. Associated to a T127 spectral grid representation. Includes a binary land-sea mask.
- T255                 Gaussian global grid of approx. 0.5 degree resolution, 384x768 nlatxnlon. Associated to a T255 spectral grid representation.
[26]:
grid_era5 = clore.Grid(grid_id="0pt25deg_era5")
grid_era5
[26]:
clisops 721x1440_cells_grid
Lat x Lon:        721 x 1440
Average resolution (x,y): (np.float32(0.25), np.float32(0.25))
Gridcells:        1038240
Format:           CF
Type:             regular_lat_lon
Extent:           global
Extent (x):       global
Extent (y):       global
Source:           Predefined_0pt25deg_era5
Bounds?           True
Degenerate cells? False
Duplicated cells? False
Permanent Mask:
md5 hash:         cdf4f59eab828857bc0c2819c0c465d7
clisops.core.Grid objects can be compared to one another
Optional verbose output gives information on where the grids differ: lat, lon, lat_bnds, lon_bnds, mask?
Compare the tos dataset to the tos dataarray
[27]:
comp = grido.compare_grid(grido_tos, verbose=True)
print("Grids are equal?", comp)
---------------------------------------------------------------------------
NameError                                 Traceback (most recent call last)
Cell In[27], line 1
----> 1 comp = grido.compare_grid(grido_tos, verbose=True)
      2 print("Grids are equal?", comp)

NameError: name 'grido' is not defined
Compare both 0.25° ERA5 Grids
[28]:
# Create the Grid object
grid_era5_lsm = clore.Grid(grid_id="0pt25deg_era5_lsm", compute_bounds=True)
/home/docs/checkouts/readthedocs.org/user_builds/clisops/conda/latest/lib/python3.12/site-packages/clisops/utils/dataset_utils.py:1853: UserWarning: For coordinate variable 'latitude' no bounds can be identified.
  warnings.warn(f"For coordinate variable '{coordinate}' no bounds can be identified.")
/home/docs/checkouts/readthedocs.org/user_builds/clisops/conda/latest/lib/python3.12/site-packages/clisops/utils/dataset_utils.py:1853: UserWarning: For coordinate variable 'longitude' no bounds can be identified.
  warnings.warn(f"For coordinate variable '{coordinate}' no bounds can be identified.")
/home/docs/checkouts/readthedocs.org/user_builds/clisops/conda/latest/lib/python3.12/site-packages/clisops/core/regrid.py:1505: UserWarning: Successfully calculated a set of latitude and longitude bounds. They might, however, differ from the actual bounds of the model grid.
  warnings.warn(
[29]:
# Compare
comp = grid_era5.compare_grid(grid_era5_lsm, verbose=True)
print("Grids are equal?", comp)
The two grids are considered equal.
Grids are equal? True
clisops.core.Weights
Create regridding weights to regrid between two grids. Supported are the following of xESMF’s remapping methods:
nearest_s2dbilinearconservativepatch
Create 2-degree target grid
[35]:
grid_2deg = clore.Grid(grid_id="2deg_lsm", compute_bounds=True)
grid_2deg
/home/docs/checkouts/readthedocs.org/user_builds/clisops/conda/latest/lib/python3.12/site-packages/clisops/utils/dataset_utils.py:1853: UserWarning: For coordinate variable 'lat' no bounds can be identified.
  warnings.warn(f"For coordinate variable '{coordinate}' no bounds can be identified.")
/home/docs/checkouts/readthedocs.org/user_builds/clisops/conda/latest/lib/python3.12/site-packages/clisops/utils/dataset_utils.py:1853: UserWarning: For coordinate variable 'lon' no bounds can be identified.
  warnings.warn(f"For coordinate variable '{coordinate}' no bounds can be identified.")
/home/docs/checkouts/readthedocs.org/user_builds/clisops/conda/latest/lib/python3.12/site-packages/clisops/core/regrid.py:1505: UserWarning: Successfully calculated a set of latitude and longitude bounds. They might, however, differ from the actual bounds of the model grid.
  warnings.warn(
[35]:
clisops 90x180_cells_grid
Lat x Lon:        90 x 180
Average resolution (x,y): (np.float64(2.0), np.float64(2.0))
Gridcells:        16200
Format:           CF
Type:             regular_lat_lon
Extent:           global
Extent (x):       global
Extent (y):       global
Source:           Predefined_2deg_lsm
Bounds?           True
Degenerate cells? False
Duplicated cells? False
Permanent Mask:
md5 hash:         438f79b4376004d360a56fa2c0abb9f0
Create conservative remapping weights using the clisops.core.Weights class
grid_in and grid_out are Grid objects
[36]:
%time weights = clore.Weights(grid_in = grido, grid_out = grid_2deg, method="conservative")
CPU times: user 8 μs, sys: 0 ns, total: 8 μs
Wall time: 11.4 μs
---------------------------------------------------------------------------
NameError                                 Traceback (most recent call last)
Cell In[36], line 1
----> 1 get_ipython().run_line_magic('time', 'weights = clore.Weights(grid_in = grido, grid_out = grid_2deg, method="conservative")')

File <timed exec>:1
----> 1 'Could not get source, probably due dynamically evaluated source code.'

NameError: name 'grido' is not defined
Local weights cache
Weights are cached on disk and do not have to be created more than once. The default cache directory is platform-dependent and set via the package platformdirs. For Linux it is '/home/my_user/.local/share/clisops/weights_dir' and can optionally be adjusted:
permanently by modifying the parameter
grid_weights: local_weights_dirin theroocs.iniconfiguration file that can be found in the clisops installation directoryor temporarily via:
from clisops import core as clore
clore.weights_cache_init("/dir/for/weights/cache")
[37]:
from clisops.core.regrid import CONFIG

print(CONFIG["clisops:grid_weights"]["local_weights_dir"])
/home/docs/.local/share/clisops/grid_weights
[38]:
!ls -sh {CONFIG["clisops:grid_weights"]["local_weights_dir"]}
total 0
[39]:
!cat {CONFIG["clisops:grid_weights"]["local_weights_dir"]}/weights_*_conservative.json
cat: '/home/docs/.local/share/clisops/grid_weights/weights_*_conservative.json': No such file or directory
Now the weights will be read directly from the cache
[40]:
%time weights = clore.Weights(grid_in = grido, grid_out = grid_2deg, method="conservative")
CPU times: user 15 μs, sys: 0 ns, total: 15 μs
Wall time: 21 μs
---------------------------------------------------------------------------
NameError                                 Traceback (most recent call last)
Cell In[40], line 1
----> 1 get_ipython().run_line_magic('time', 'weights = clore.Weights(grid_in = grido, grid_out = grid_2deg, method="conservative")')

File <timed exec>:1
----> 1 'Could not get source, probably due dynamically evaluated source code.'

NameError: name 'grido' is not defined
The weights cache can be flushed, which removes all weight and grid files as well as the json files holding the metadata. To see what would be removed, one can use the dryrun=True parameter. To re-initialize the weights cache in a different directory, one can use the weights_dir_init="/new/dir/for/weights/cache" parameter. Even when re-initializing the weights cache under a new path, using clore.weights_cache_flush, no directory is getting removed, only above listed files. When
dryrun is not set, the files that are getting deleted can be displayed with verbose=True.
[41]:
clore.weights_cache_flush(dryrun=True)
Flushing the clisops weights cache ('/home/docs/.local/share/clisops/grid_weights') would remove:
No weight or grid files found. Cache empty?
[42]:
clore.weights_cache_flush(verbose=True)
Flushing the clisops weights cache ('/home/docs/.local/share/clisops/grid_weights'). Removing ...
No weight or grid files found. Cache empty?
Initialized new weights cache at /home/docs/.local/share/clisops/grid_weights
clisops.core.regrid
This function allows to perform the eventual regridding and provides a resulting xarray.Dataset
def regrid(
    grid_in: Grid,
    grid_out: Grid,
    weights: Weights,
    adaptive_masking_threshold: Optional[float] = 0.5,
    keep_attrs: Optional[bool] = True,
):
    pass
grid_inandgrid_outareGridobjects,weightsis aWeightsobject.adaptive_masking_threshold(AMT) A value within the [0., 1.] interval that defines the maximumRATIOof missing_values amongst the total number of data values contributing to the calculation of the target grid cell value. For a fraction [0., AMT[ of the contributing source data missing, the target grid cell will be set to missing_value, else, it will be re-normalized by the factor1./(1.-RATIO). Thus, if AMT is set to 1, all source grid cells that contribute to a target grid cell must be missing in order for the target grid cell to be defined as missing itself. Values greater than 1 or less than 0 will cause adaptive masking to be turned off. This adaptive masking technique allows to reuse generated weights for differently masked data (e.g. land-sea masks or orographic masks that vary with depth / height).keep_attrscan have the following settings:True: The resultingxarray.Datasetwill have all attributes ofgrid_in.ds.attrs, despite attributes that have to be added and altered due to the new grid.False: The resultingxarray.Datasetwill have no attributes despite attributes generated by the regridding process."target": The resultingxarray.Datasetwill have all attributes ofgrid_out.ds.attrs, despite attributes generated by the regridding process. Not recommended.
In the following an example showing the function application and the effect of the adaptive masking.
[43]:
ds_out_amt0 = clore.regrid(grido, grid_2deg, weights, adaptive_masking_threshold=-1) # noqa: F821
---------------------------------------------------------------------------
NameError                                 Traceback (most recent call last)
Cell In[43], line 1
----> 1 ds_out_amt0 = clore.regrid(grido, grid_2deg, weights, adaptive_masking_threshold=-1)  # noqa: F821

NameError: name 'grido' is not defined
[44]:
ds_out_amt1 = clore.regrid(grido, grid_2deg, weights, adaptive_masking_threshold=0.5) # noqa: F821
---------------------------------------------------------------------------
NameError                                 Traceback (most recent call last)
Cell In[44], line 1
----> 1 ds_out_amt1 = clore.regrid(grido, grid_2deg, weights, adaptive_masking_threshold=0.5)  # noqa: F821

NameError: name 'grido' is not defined
Plot the resulting data
[45]:
# Create panel plot of regridded data (global)
fig, axes = plt.subplots(
    ncols=2,
    nrows=1,
    figsize=(18, 5),  # global
    subplot_kw={"projection": ccrs.PlateCarree()},
)

ds_out_amt0["tos"].isel(time=0).plot.pcolormesh(ax=axes[0], vmin=0, vmax=30, cmap="plasma")
axes[0].title.set_text("Target (2° regular lat-lon) - No adaptive masking")

ds_out_amt1["tos"].isel(time=0).plot.pcolormesh(ax=axes[1], vmin=0, vmax=30, cmap="plasma")
axes[1].title.set_text("Target (2° regular lat-lon) - Adaptive masking")

for axis in axes.flatten():
    axis.coastlines()
    axis.set_xlabel("lon")
    axis.set_ylabel("lat")
---------------------------------------------------------------------------
NameError                                 Traceback (most recent call last)
Cell In[45], line 9
      5     figsize=(18, 5),  # global
      6     subplot_kw={"projection": ccrs.PlateCarree()},
      7 )
      8
----> 9 ds_out_amt0["tos"].isel(time=0).plot.pcolormesh(ax=axes[0], vmin=0, vmax=30, cmap="plasma")
     10 axes[0].title.set_text("Target (2° regular lat-lon) - No adaptive masking")
     11
     12 ds_out_amt1["tos"].isel(time=0).plot.pcolormesh(ax=axes[1], vmin=0, vmax=30, cmap="plasma")

NameError: name 'ds_out_amt0' is not defined

[46]:
# Create a panel plot of regridded data (Japan)
fig, axes = plt.subplots(
    ncols=3,
    nrows=1,
    figsize=(18, 4),  # Japan
    subplot_kw={"projection": ccrs.PlateCarree()},
)

grido.ds.tos.isel(time=0).plot.pcolormesh(
    ax=axes[0], x=grido.lon, y=grido.lat, vmin=0, vmax=30, cmap="plasma", shading="auto"
)
axes[0].title.set_text("Source - MPI-ESM1-2-HR MPIOM (TP04, ~0.4° resolution)")

ds_out_amt0["tos"].isel(time=0).plot.pcolormesh(ax=axes[1], vmin=0, vmax=30, cmap="plasma")
axes[1].title.set_text("Target - No adaptive masking")

ds_out_amt1["tos"].isel(time=0).plot.pcolormesh(ax=axes[2], vmin=0, vmax=30, cmap="plasma")
axes[2].title.set_text("Target - Adaptive masking")

for axis in axes.flatten():
    axis.coastlines()
    axis.set_xlabel("lon")
    axis.set_ylabel("lat")
    axis.set_xlim([125, 150])
    axis.set_ylim([25, 50])
---------------------------------------------------------------------------
NameError                                 Traceback (most recent call last)
Cell In[46], line 9
      5     figsize=(18, 4),  # Japan
      6     subplot_kw={"projection": ccrs.PlateCarree()},
      7 )
      8
----> 9 grido.ds.tos.isel(time=0).plot.pcolormesh(
     10     ax=axes[0], x=grido.lon, y=grido.lat, vmin=0, vmax=30, cmap="plasma", shading="auto"
     11 )
     12 axes[0].title.set_text("Source - MPI-ESM1-2-HR MPIOM (TP04, ~0.4° resolution)")

NameError: name 'grido' is not defined